The logarithmic relationship between "Lux" and the resistance of the LDR is shown above. What is the difference between lumens and lux? Lumens is the total light given off by a source, lux is simply a measure of the "lumen flux", or how much of that light/lumens emitted actually falls on target/sensor. For example, a spherical light source giving off a constant number of lumens, we would expect the measured lux to vary as an inverse square law to the distance from the light source. In our case our little red LED spits out 2-3 lumens, in a non-spherical, conical-type distribution.
Let's assume if we position our LDR close enough to the LED that we can collect about 1 lumen (i.e 1 lux) of the light that is given out, but in reality it will probably be even less than this. Imagine 1000 lux are incident on the LDR and our LED turns on... 1001 lux. What is the change in resistance that we might measure? See the graph - almost no change! If the LDR is in near total darkness, around 0.1 lux and the LED turns on... 1.1 lux on the LDR, meaning a change in resistance from 1 MOhm to around 100 kOhm - almost a 10-fold change. So it is easier to measure a small change in light when we are in the dark... which is kind of obvious I suppose. Thankfully my electricity meter is in a self-contained box and the light levels within it are very low.
So putting the LDR in as much darkness as possible is a good idea but it's not the full story. The other component in the circuit is a resistor, which acts simply forms a voltage divider. In the darkness of the box when the LED is off (say 0.1 lux), the graph predicts the LDR will have a resistance of 1 MOhm. Therefore if we use a 10k resistor, the voltage divider when the LED is off will be:
In parenthesis I have indicated what integer value a 10-bit ADC would measure the voltage as, between 0 and 1023. When the LED turns on, the LDR will change to about 100 kOhm, giving a voltage at the voltage divider of:
V_on = 3.3 V * 10,000/ (10,000 + 100,000) = 0.3 V (10-bit ADC = 93)
Although our baseline ADC value is good (10 units), we only have a 83 difference (93-10) between the LED off and the LED on. This is less than 10% of our potential signal - how can we improve it? Clearly by increasing the value of the resistor, V_off will increased a little, but V_on will be increased more. For example with R = 100 kOhm:
V_off = 0.3 V (10-bit ADC = 93)
V_on = 1.65 V (10-bit ADC = 511)
That's a window of around 40% the ADC signal, a really measurable increase. What would happen if we were to increase the value of the resistor again? Let's go crazy and put a 10 MOhm resistor in. Now:
V_off = 3 V (10-bit ADC = 930)
V_on = 3.27 V (10-bit ADC = 1013)
What's happened now? Well we have greatly increased our sensitivity, as seen by the high voltage we get when the LED is off, in the dark, but we are so close to the top of the range (3 volts, of 3.3 v max), that when the LED comes on we only get a small change in voltage. Clearly we need a resistor value that brings the dark voltage, V_off, down "low enough" and is still sensitive enough to give us a nice detectable signal. In my case I ended up using a 1 MOhm resistor which gave a V_off of 0.3 V and a V_on around 1.5 V - a nice balance.
The theory is interesting but from a practical stand-point my advice is try to keep the LDR in as much darkness as possible and to try a few resistor values starting from 10k, or use a 1 M resistor pot. As you increase the resistance, the background voltage will rise in the dark, but so will the signal when the LED comes on until you find a sweet spot for robust pulse detection.
Software signal processing
Processing the pulse signal is really easy. First, I use an analog read on pin A0 to measure the current voltage across the resistor:
signal = analogRead(A0);
To obtain a smooth baseline from which to measure LED pulses against, I apply a complimentary filter as a low-pass filter to the analog signal like so:
baseline = baseline * 0.99f + signal * 0.01f;
Note that because the baseline smoothing is slow and the LED pulse is fast, the value of the baseline is not affected much by the LED pulsing. Subtracting the baseline from the measured signal gives us a cleaned up signal;
clean = signal - baseline;
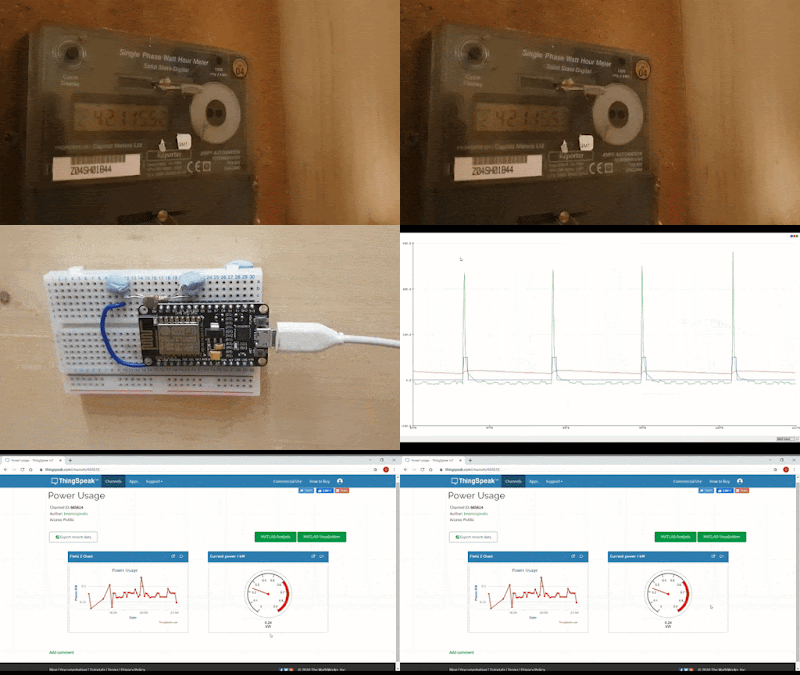
The 'clean' signal will be 0 when the LED is off, and 100-300 when the LED pulses on. By applying hysteresis to the thresholds used for measuring when a detected pulse starts and stops, pulses can be cleanly detected. For good measure a limit of 100 ms is applied for the pulse length, to eliminate false positives from light being introduced into the box. In addition I count for ten periods and divide the total time by ten to improve accuracy. This simple algorithm works surprisingly well for detecting the LED pulses robustly. Now that we can detect and measure the timing of the pulses, how do we calculate the power usage?
Calculating the power usage
This is where I have seen confusion between kW and kWh. The former is a rate of energy usage in units of kJ per second, the latter is the total amount of energy we have used. We can calculate the total energy we use in an hour (in kWh) by multiplying the energy use per second by the number of hours we can been using the energy:
Total power (kWh) = 1(h) * rate(kW)
[ASIDE: our flashing LED is actually totting up the amount of energy we are using and so reports back in kWh, but for our purposes this is equivalent to telling us the rate of energy use at that moment in kW, as revealed by the above equation].
So how do we work out the power rate from the LED pulsing time? Let's imagine we use 1 kWh of energy, that is 1 kW of energy every second for 3600 seconds. The LED pulses 1000 times in an hour, giving a pulse period in seconds of 3600s/1000 = 3.6 seconds. If 1 kW corresponds to a 3.6 second period, then we can calculate the energy for a general period, t.
Energy rate (kW) = 3.6(s) / t(s)
If we log the period in milliseconds, the equivalent calculation is:
Energy rate (kW) = 3600(ms) / t(ms)
Reporting the data


Good Job! Do you have link to sofware?
ReplyDeleteHi Tom. The code in its entirety is in the blog post.
DeleteThis comment has been removed by a blog administrator.
ReplyDelete